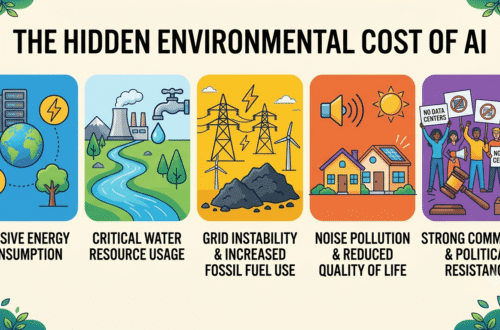

The Critical Numbers Behind Data Center Electricity Consumption: A Full Calculation Guide
A Number That Deserves Real Arithmetic
Data center electricity consumption gets thrown around in headlines constantly. Gigawatts here. Terawatt-hours there. What rarely accompanies these figures is the actual math connecting them. This article walks through the real formulas, sourced from the International Energy Agency, Lawrence Berkeley National Laboratory, and independent industry research, and shows exactly how a facility’s rated capacity translates into its true annual power draw and cost.
The Core Metric: Power Usage Effectiveness
Every serious calculation of data center electricity consumption starts with one formula.
PUE = Total Facility Power ÷ IT Equipment Power
A PUE of 1.0 represents perfect efficiency, meaning every watt entering the building powers actual computing hardware, with zero overhead for cooling, lighting, or power distribution. That number is theoretical. Real facilities never reach it.
The global average PUE sits between 1.5 and 1.6, according to industry benchmarking. Best-in-class hyperscale facilities achieve 1.1 to 1.2. Cooling alone typically consumes 20 to 40 percent of total facility electricity, depending on the cooling architecture in use. This overhead is precisely why PUE matters so much when calculating real-world data center electricity consumption. A facility’s IT load and its actual grid draw are two genuinely different numbers.
Calculating One Facility’s Annual Draw
Here is the full formula that connects a facility’s rated megawatt capacity to its actual annual electricity consumption, drawn directly from Axis Intelligence Research’s published methodology.
Annual Electricity (kWh) = Capacity (MW) × 8,760 hours × PUE × Utilization Rate
Each term deserves explanation. Capacity is the facility’s rated power draw in megawatts. The figure 8,760 represents the total hours in a year, since data centers run continuously. PUE accounts for cooling and distribution overhead. Utilization rate reflects that facilities rarely run at 100 percent capacity around the clock.
Applying this to a 100 MW facility at a PUE of 1.14, a figure representative of modern hyperscale efficiency, and 71 percent utilization, a realistic industry average, gives a concrete result.
100 MW × 8,760 hours × 1.14 = 998,640 MWh, or approximately 999 GWh at full theoretical capacity
Applying the 71 percent utilization factor brings this down to the facility’s actual expected annual draw.
999 GWh × 0.71 ≈ 709 GWh per year, the real-world annual electricity consumption for this facility
This single calculation explains why headline “capacity” figures for announced data centers often overstate actual consumption. Utilization, not just rated capacity, determines the true number.
From Annual Figures to Daily Draw
Breaking this down to a daily figure makes the scale more intuitive. Using the 709 GWh annual result:
709,000 MWh ÷ 365 days ≈ 1,942 MWh per day, or roughly 1.9 GWh per day for this 100 MW facility
This aligns closely with independent estimates. Industry tracking places a typical hyperscale data center rated at 50 to 100 MW at 1.2 to 2.4 gigawatt-hours of daily consumption, enough to power between 42,000 and 85,000 American homes for a single day. Smaller enterprise facilities, rated at 1 to 5 MW, consume a proportionally smaller 24 to 120 megawatt-hours daily, equivalent to roughly 850 to 4,200 homes.
At the largest end of the scale, AI-optimized hyperscaler campuses can consume 10 to 25 GWh per day. Applying the same ratio used above, a 1 GW facility follows directly:
1,000 MW ÷ 100 MW × 1.9 GWh = 19 GWh per day for a full gigawatt-scale AI campus
Verifying the Formula Against a Named Facility
Meta’s planned Hyperion campus in Louisiana offers a real-world check on these calculations. The facility is designed to require at least 5 gigawatts of continuous power. Applying the same per-day formula:
5,000 MW ÷ 100 MW × 1.9 GWh = 95 GWh per day for Hyperion at full planned capacity
For context, this single facility’s daily draw is described directly by the Institute on Taxation and Economic Policy as roughly three times the total electricity consumption of the city of New Orleans, and equivalent to the output of 2.5 Hoover Dams running continuously at peak capacity. This is not a hypothetical exercise. It is one specific, already-announced facility.
National and Global Totals
Zooming out from individual facilities, US data centers collectively consumed approximately 501 GWh per day in 2024, according to Lawrence Berkeley National Laboratory tracking, representing just over 4 percent of total US electricity consumption. Annualizing that daily figure provides a useful cross-check against LBNL’s own reported total.
501 GWh per day × 365 days ≈ 182,865 GWh, or approximately 183 TWh per year
This matches LBNL’s directly reported figure of 176 TWh for 2023 and 180 TWh for 2024 almost exactly, confirming the daily-to-annual conversion holds up against independently published totals.
Globally, the IEA’s Energy and AI report puts total data center electricity consumption at 415 TWh in 2024, representing 1.5 percent of global electricity demand. The IEA projects this figure will more than double, reaching 945 TWh by 2030, a total that would exceed the current entire electricity consumption of Japan. The growth rate calculation here is worth stating explicitly.
945 TWh ÷ 415 TWh ≈ 2.28 times growth between 2024 and 2030
AI-focused facilities are driving this disproportionately. In 2025 alone, AI-focused data centers drove a 17 percent surge in global data center electricity consumption, against just 3 percent growth in overall global electricity demand. That gap, 17 percent versus 3 percent, captures the entire story of how AI is reshaping electricity demand relative to every other sector of the economy simultaneously.
What This Costs in Real Dollars
Electricity consumption translates directly into operating cost, and this calculation matters enormously for anyone evaluating data center economics. Using the US weighted-average industrial electricity rate of 0.0834 dollars per kWh, applied to a 1 MW facility running at PUE 1.14 and 71 percent utilization:
1 MW × 8,760 hours × 1.14 × 0.71 × $0.0834 per kWh ≈ $626,000 per MW per year
This figure shifts dramatically based on regional electricity pricing. In cheap-power markets, where rates fall to around 0.047 dollars per kWh, the same formula produces roughly 353,000 dollars per MW annually. In expensive coastal markets, where rates can exceed 0.15 dollars per kWh, annual cost per megawatt climbs past 1.1 million dollars. For a 100 MW facility, that spread represents a difference between 35 million and 110 million dollars in annual electricity cost alone, purely based on where the facility is sited.
Why Rack Density Changes the Math Entirely
A final calculation worth including addresses a trend reshaping the entire industry. IEA data documents that AI server power density increased eleven times between 2020 and 2025, with a further fourfold increase projected by 2027. At that projected density, a single rack the size of a household refrigerator would carry peak demand equivalent to 65 households.
This matters because it changes what “megawatt” actually means in practice. A modern AI-class data center at 100 MW can consume more power per day than a traditional 300 MW data center from 2018, purely because rack density and utilization have both increased so dramatically. Comparing raw megawatt figures across facility generations without accounting for this shift produces genuinely misleading comparisons.
The Grid Impact This Produces
These calculations carry direct consequences beyond the data center’s own meter. In the US, data centers are on course to account for nearly half of all electricity demand growth between now and 2030, according to IEA projections. In Virginia specifically, data centers already consume approximately 25 percent of total state electricity. Carnegie Mellon University research estimates that data centers and cryptocurrency mining together could increase average US electricity bills by 8 percent by 2030, potentially exceeding 25 percent in high-demand concentrated markets like Northern Virginia.
Conclusion
Data center electricity consumption is not a single, fixed number. It is the product of several multiplicative factors, rated capacity, PUE, utilization rate, and hours in operation, each of which can shift the final figure by a substantial margin. A 100 MW facility can draw anywhere from roughly 700 GWh to nearly 1,000 GWh annually depending purely on utilization and efficiency assumptions.
For anyone evaluating a proposed data center’s true impact on a local grid, or its genuine operating cost, the formula demonstrated throughout this article, capacity multiplied by 8,760 hours, multiplied by PUE, multiplied by utilization rate, is the calculation that actually matters. Rated capacity alone tells only part of the story.


You May Also Like
Does Anthropic Have a Critical Claude Open Weight Blind Spot?

The Startling Truth About AI ROI: Why 95 Percent of Enterprise Projects Are Failing